Zepbound Weight Loss Calculator
How much weight do people actually lose on Zepbound? This calculator maps the SURMOUNT-1 trial averages onto your starting weight, your maintenance dose, and how long you have been on it.
From the SURMOUNT-1 trial (Jastreboff et al., NEJM 2022) · Free, no sign-up
Your details
Zepbound weight loss chart
SURMOUNT-1 average, mapped to your starting weight
−00−46lb
20.9% of body weight
220 lb 174 lb
Out of 100 people on 15 mg
A trial average is not a prediction. Weeks between trial timepoints are estimated. Source: SURMOUNT-1, Jastreboff et al., NEJM 2022
See your real curve
Log weigh-ins and doses, and GlucoPal charts your weight trend by dose.

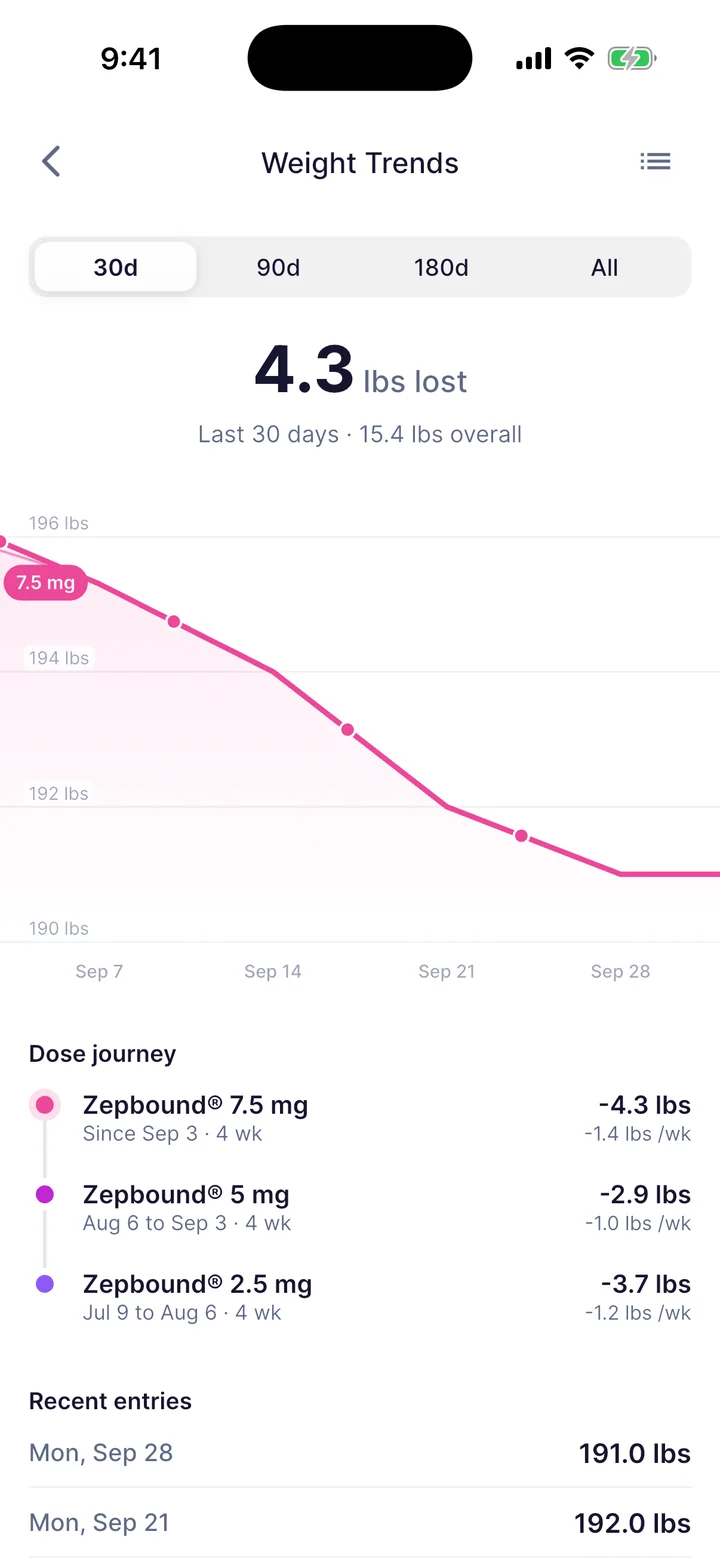
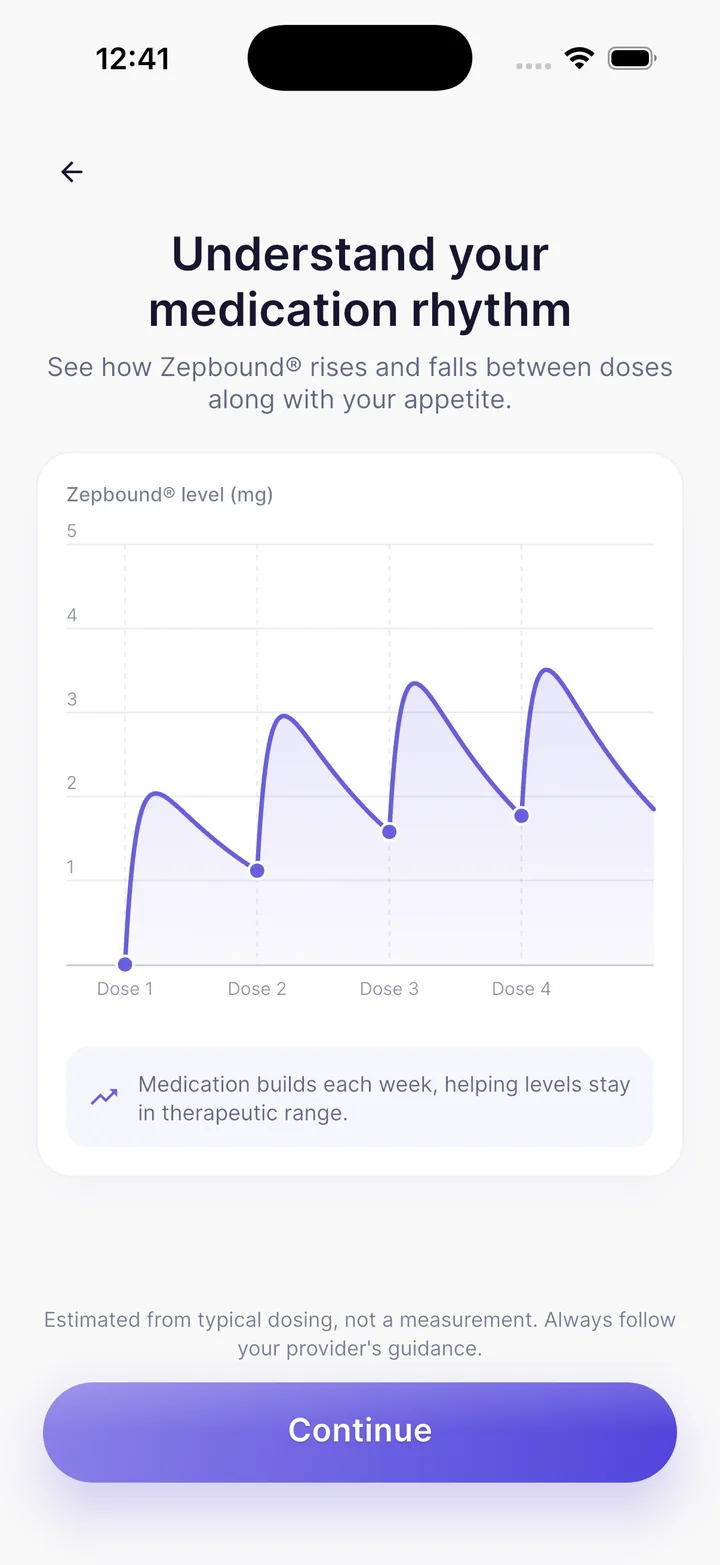
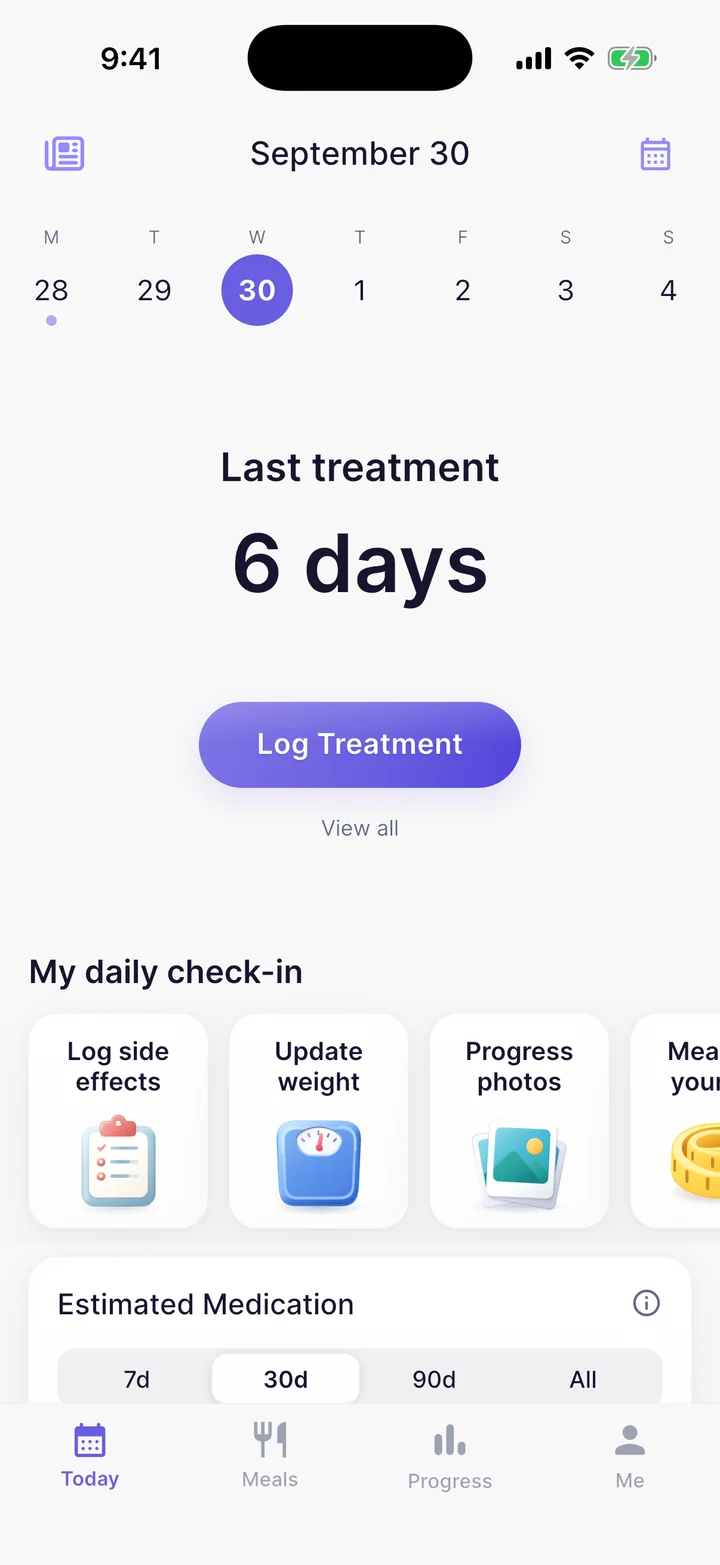
Quick answer: In SURMOUNT-1, adults with obesity and without diabetes lost an average of 15.0% of body weight on Zepbound 5 mg, 19.5% on 10 mg and 20.9% on 15 mg over 72 weeks, alongside a reduced-calorie diet and more activity. Diet and exercise alone averaged 3.1%. For a 220 lb starting weight that is roughly 33 lb, 43 lb and 46 lb. The calculator above puts your own starting weight through the same curve, and the free GlucoPal app for iPhone and Android tracks what you actually lose against it.
Educational reference only, not medical advice and not a prediction of individual results. Trial participants used the medication alongside a reduced-calorie diet and increased activity. Talk to your prescriber about what to expect for you.
Zepbound weight loss by dose and month
SURMOUNT-1 (Jastreboff et al., NEJM 2022) ran for 72 weeks in adults with obesity (BMI 30+, or 27+ with a weight-related condition), without diabetes. Average baseline weight was about 231 lb (104.8 kg), so the 15 mg average of 20.9% corresponds to roughly 48 lb for a typical participant.
| Time point | Zepbound 5 mg | Zepbound 10 mg | Zepbound 15 mg |
|---|---|---|---|
| 3 months (wk 13) | −7.3% | −8.9% | −9.6% |
| 6 months (wk 26) | −11.4% | −14.1% | −15.2% |
| 9 months (wk 39) | −13.4% | −17.0% | −18.2% |
| 12 months (wk 52) | −14.4% | −18.5% | −19.8% |
| 15 months (wk 65) | −14.8% | −19.3% | −20.7% |
| Trial end | −15.0% | −19.5% | −20.9% |
Intermediate months are estimated from the published curve shape and verified anchors; the trials publish week-by-week values only as figures. The trial-end row is the published result.
The three maintenance doses separate early and then stay separated. By month 6 the modeled 15 mg curve is around 15.2% against 11.4% on 5 mg, and the gap at the 72-week endpoint is 5.9 percentage points. Dose is the single biggest lever in this dataset.
Why your first three months look slower than the curve
Nobody starts on a maintenance dose. The Zepbound label begins at 2.5 mg once weekly for four weeks, moves to 5 mg, and then allows 2.5 mg increases no sooner than every four weeks. The earliest anyone reaches 15 mg is around week 20, so most of your first four to five months are spent climbing, not sitting at the dose the curve is named after.
That is why the trial curves are steepest through months 3 to 9 rather than in month 1. At week 12 the modeled 15 mg trajectory is only about 9.0%, well under half of where it ends up. If you are eight weeks in and comparing yourself to a headline number from week 72, you are comparing two different points on the same line.
Set the week slider on the calculator to where you actually are. The reading you want is your own trend against the curve at the same week, not against the endpoint.
The spread around the average
An average hides an enormous range. On Zepbound 15 mg at 72 weeks, 90.9% of participants lost at least 5%, 83.5% of participants lost at least 10%, 70.6% of participants lost at least 15%, and 56.7% of participants lost at least 20%. So more than half cleared 20%, and roughly one in ten did not reach 5%. Both of those people were on the same dose in the same trial.
A slow start is also a poor predictor. In a SURMOUNT-1 follow-up analysis, 18% of participants had lost less than 5% at week 12, yet 90% of that group still reached at least 5% by week 72. True non-response at the end of the trial was under 2%.
This is the practical case for logging your own numbers rather than eyeballing them. Weekly weigh-ins under the same conditions, recorded next to your doses and side effects, tell you and your prescriber far more than any single comparison to a trial average. GlucoPal is the free app for iPhone and Android built for exactly that record, and our Zepbound tracker comparison covers the alternatives.
What this calculator can and cannot tell you
It is a reference point, not a forecast. The published endpoints (week 72) and the responder percentages above are verified trial numbers. Everything between those points is modeled: SURMOUNT-1 publishes its week-by-week trajectory only as a figure, never as a numeric table. We draw a standard saturating weight-loss curve through the verified anchors, hit the published endpoint exactly, and label every intermediate week as estimated.
We also use the regulator-signed conservative estimand throughout, not the higher efficacy numbers that appear in press coverage. That is why you will see 20.9% here rather than the ~22.5% figure quoted elsewhere for 15 mg.
Finally, the trial population may not be yours: BMI 30 or above (or 27 with a weight-related condition), no diabetes, and a structured diet and activity programme running alongside the medication. The numbers reflect medication plus lifestyle change, not medication alone.
FAQ
How much weight will I lose on Zepbound in 3 months?
There is no way to predict an individual result. As a reference, the modeled SURMOUNT-1 trajectory at 13 weeks (3 months) sits near 9.6% on 15 mg, 8.9% on 10 mg and 7.3% on 5 mg. Bear in mind that at three months most people are still escalating and have not reached their maintenance dose yet, so early weeks understate where the curve ends up. For a 220 lb starting weight, 9.6% is about 21 lb.
How much weight will I lose on Zepbound in a year?
The modeled 52-week values are about 19.8% on 15 mg, 18.5% on 10 mg and 14.4% on 5 mg. The trial itself ran to 72 weeks, where the published averages are 20.9%, 19.5% and 15.0%. One-year figures are interpolated from the published curve shape, because the trial reports week-by-week values only as a figure.
Which Zepbound dose loses the most weight?
In SURMOUNT-1, 15 mg produced the largest average loss at 20.9%, against 19.5% on 10 mg and 15.0% on 5 mg. The gap between 10 mg and 15 mg is smaller than the gap between 5 mg and 10 mg, so the curve flattens as the dose rises. Dose selection is a clinical decision that balances results against side effects, and many people do well on a lower maintenance dose. That is a conversation for your prescriber.
Is Zepbound or Wegovy better for weight loss?
There is a published head-to-head. In SURMOUNT-5, 751 adults with obesity and without diabetes were randomised to tirzepatide or semaglutide for 72 weeks, each titrated to their maximum tolerated dose. Tirzepatide averaged 20.2% weight loss against semaglutide's 13.7%, and 19.7% of the tirzepatide group lost at least 30% of their body weight against 6.9% on semaglutide. Two caveats: the trial was open-label, and it ran before the higher-dose Wegovy HD 7.2 mg injection existed, so its semaglutide arm was capped at 2.4 mg. Tolerability, cost, insurance coverage, and availability still matter as much as the average for any individual choice, and that is a conversation for your prescriber.
Is Zepbound the same as Mounjaro for weight loss?
Same molecule, tirzepatide, at the same maintenance doses. Zepbound is the brand prescribed for weight management in the US, and Mounjaro is the tirzepatide brand prescribed for weight management in the UK and Australia. SURMOUNT-1 is the reference weight-loss trial for both, so the curves in this calculator apply either way.
What if I am losing more slowly than the Zepbound average?
It is common and it is a weak signal early on. In a SURMOUNT-1 follow-up analysis, 18% of participants had lost less than 5% at week 12, and 90% of that group still reached at least 5% by week 72. What matters clinically is your own trend across weeks, not any single weigh-in or any single comparison to an average. Keep a consistent record of weight, doses, meals, and side effects so you and your clinician can see the actual trend, and raise a genuine plateau with your prescriber rather than changing anything on your own.
Does weight loss on Zepbound stop at some point?
The trial curves flatten rather than stop. On 5 mg the SURMOUNT-1 average had essentially reached its plateau by week 72; on 10 mg and 15 mg it was still edging down slightly at the end of the trial. A published analysis of SURMOUNT-1 and SURMOUNT-4 puts the typical plateau somewhere around week 60 and later for the higher doses. A flattening curve after a year on a stable dose is the expected shape, not a failure.
Is this calculator free, and do I need to sign up?
Yes, it is free, and no sign-up or email is required. You see the full result instantly: the trial average for your starting weight, the month-by-month curve, and the responder milestones. The GlucoPal iOS app it comes from is also free to download.
Other medications
- Mounjaro weight loss calculatorSame molecule, same SURMOUNT-1 data, set up in kg for the UK and Australia.
- Wegovy weight loss calculatorAll three forms: the 2.4 mg injection, Wegovy HD 7.2 mg, and the 25 mg daily tablet.
- Foundayo weight loss calculatorThe daily orforglipron pill, from the ATTAIN-1 trial.
- Compare all four medicationsEvery trial average side by side in one table.
Sources
- Aronne et al., Tirzepatide as Compared with Semaglutide for the Treatment of Obesity (SURMOUNT-5), NEJM 2025
- Tirzepatide Once Weekly for the Treatment of Obesity (SURMOUNT-1), NEJM 2022
- Zepbound Prescribing Information (DailyMed), including the dose escalation schedule
- FDA Statistical Review, NDA 217806 (intermediate week-20 anchors)
- Ard et al. 2025, early weight loss response in SURMOUNT-1
- Horn et al. 2025, time to weight plateau in SURMOUNT-1 and SURMOUNT-4
Built and maintained by GlucoPal, the free app for iPhone and Android for tracking GLP-1 weight loss medications. The GLP-1 Tracker by GlucoPal app is rated 4.8 stars from over 7,000 ratings worldwide and used by 100,000+ people. The calculator runs entirely in your browser and stores no health data.
You take your GLP-1s. We'll take care of the rest.